US Non-Profit Organizations
Project Overview
The goal of this project is to better understand US Non-profit organizations and how they perform when compared to each other based on income, revenue, and assets. Furthermore, we will look at the Top 10 Non-profits in the regions and the Top 10 per state. The Dataset was obtained from Kaggle, which contains information on US Non-profits broken up into three regions. We will clean the data, isolate the info needed, and export data to be visualized in Tableau.
Link to Dataset: Non-Profit
Link to GitHub Repo: GitHub
Link to Tableau Visualizations: Visualization
Data Cleaning
First we import our libraries, like Pandas, NumPy, and Seaborn, with some other parameters. Next we import the data into Jupyter Notebooks and display the data to see what they provide.
# Import Libaries and Parameters for Seaborn.
import pandas as pd
import os
import matplotlib.pyplot as plt
import seaborn as sns
%matplotlib inline
plt.rcParams['figure.figsize'] = 20,20
import warnings
warnings.filterwarnings('ignore')

#Import Data using Pandas
ds1 = pd.read_csv('eo1.csv')
ds2 = pd.read_csv('eo2.csv')
ds3 = pd.read_csv('eo3.csv')

ds1.head()
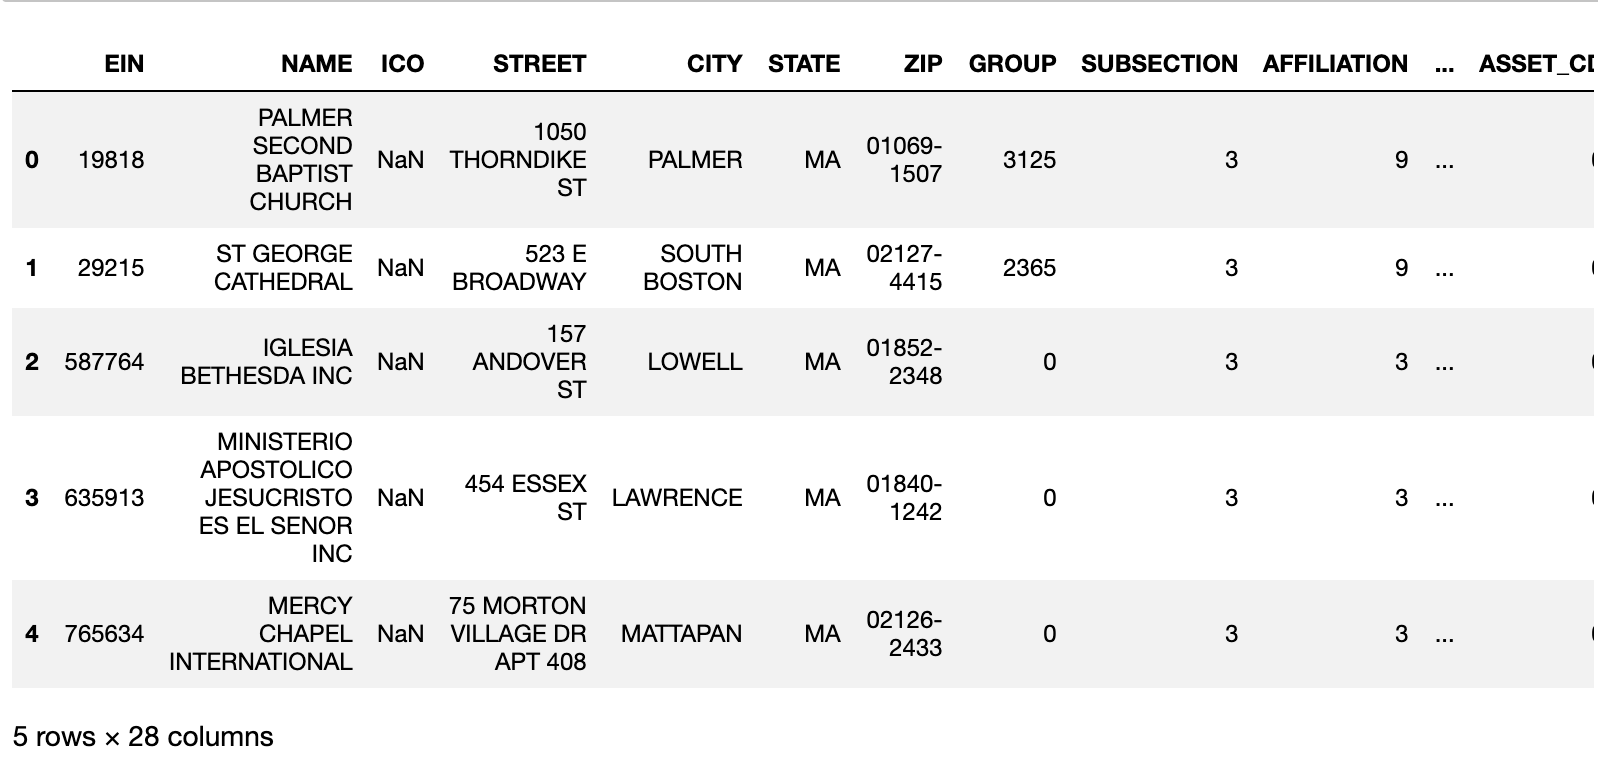
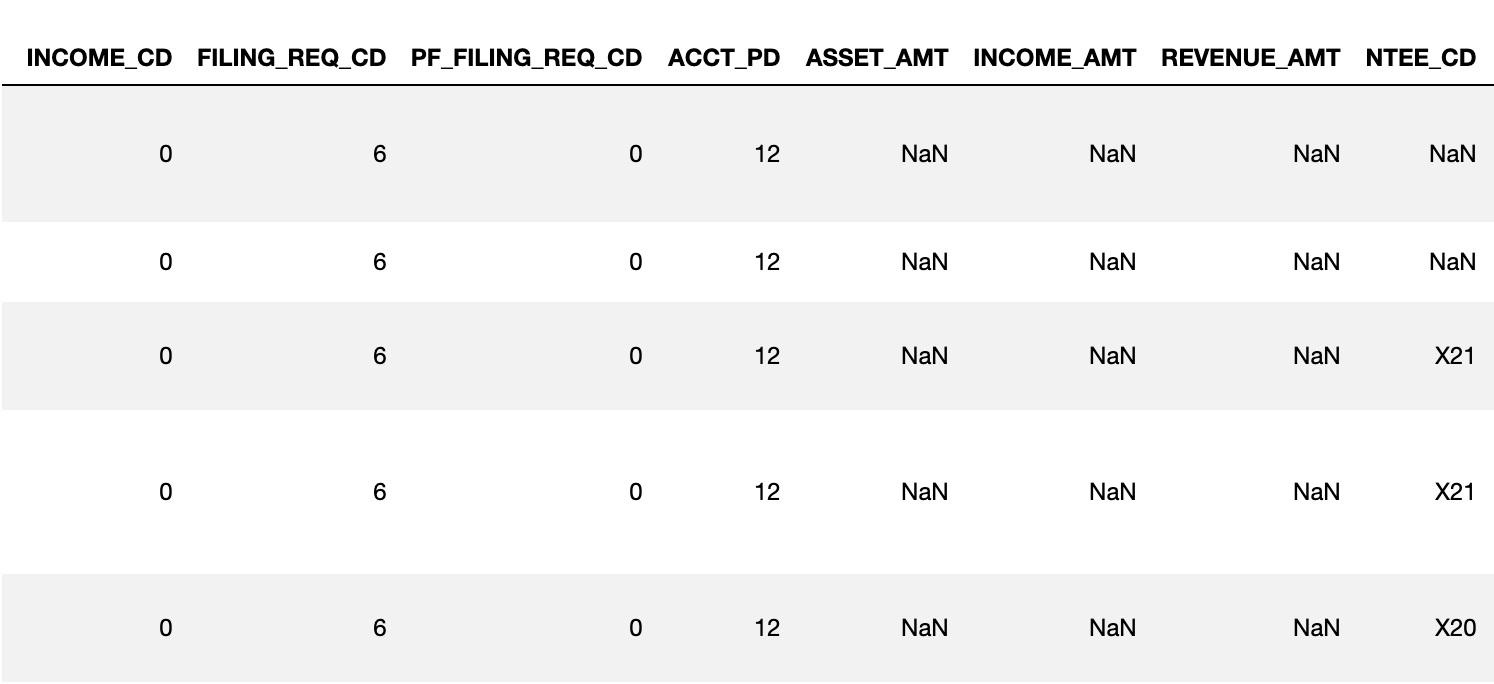 Looking at the data we can see most of the information is internal coding to other points of data. For example, Subsection, Affiliation, etc. What we need is the basic information on each organization and the financials, Income/Revenue/Assets.
First, we will check how the states are broken up in each file.
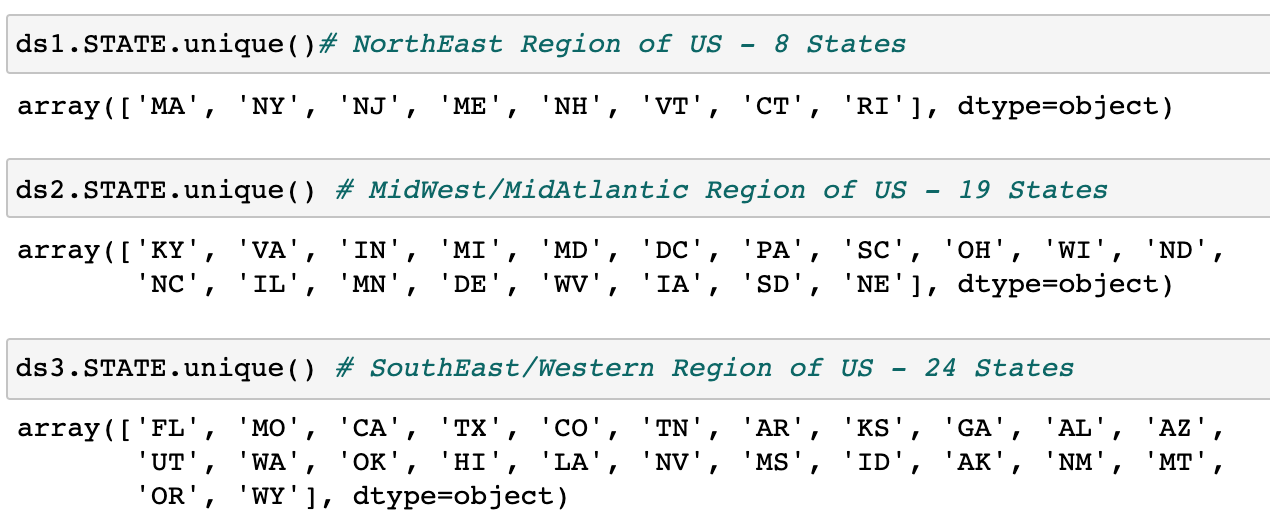 We could change the data to make them more conform to the US standard regions, but since we will be separating at the state level later this will be fine for the time being.
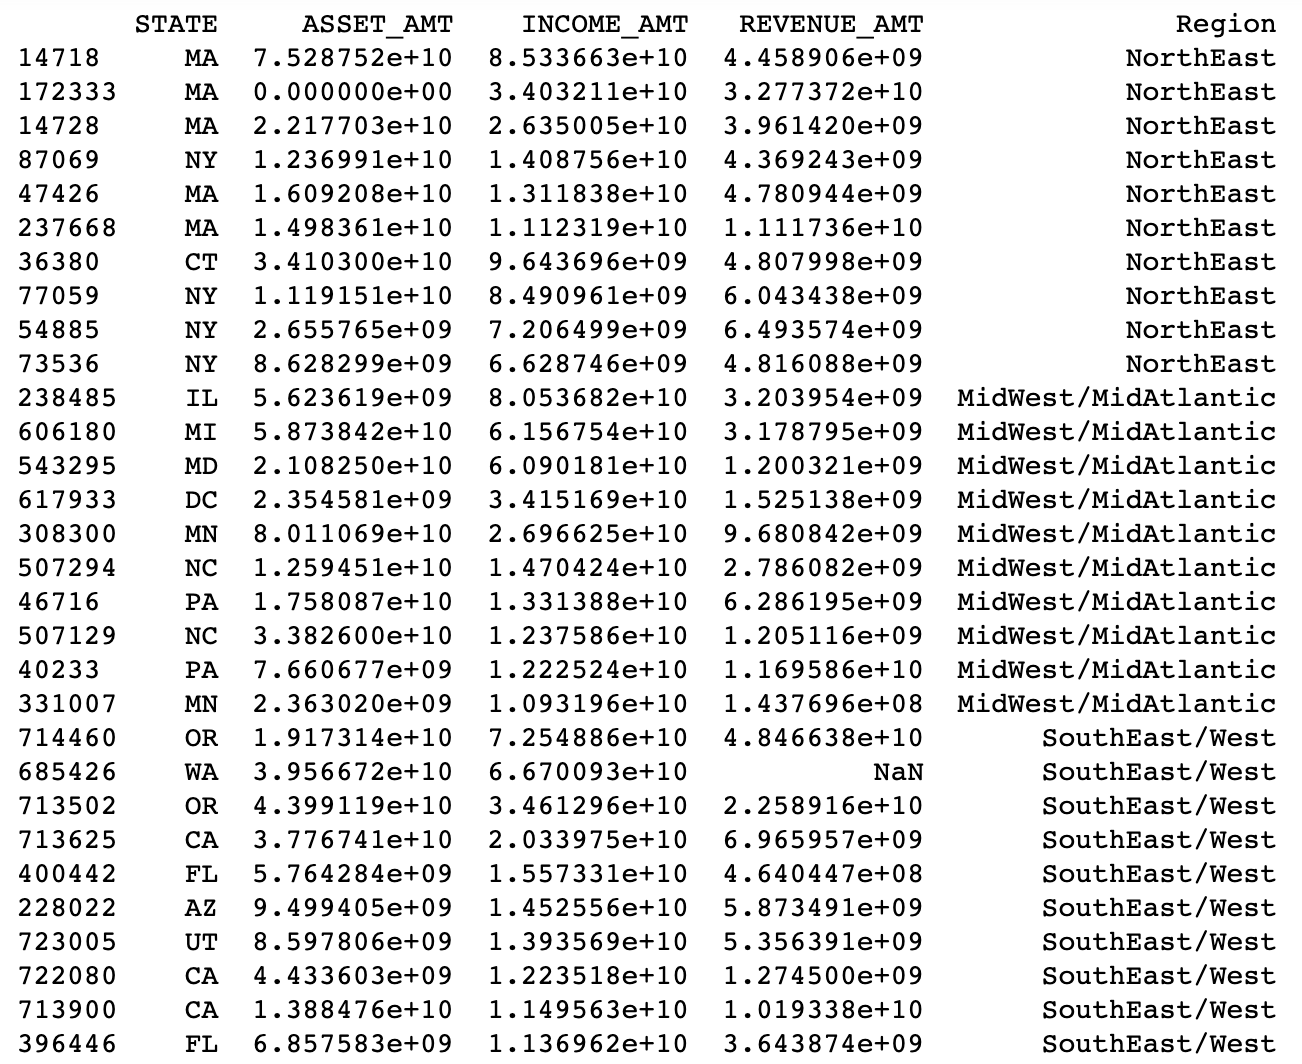
Below we are seperating the data into a new region variable for visualization. The first line of code is sorting the data in descending order based on Income and only taking the Name, City, State, Asset, Income, and Revenue columns. Second line adds a new column for the Region. Giving us the Top 10 US Non-Profits based on Income per Region. Note again that these regions were created by the supplier of the data, the IRS.
#NorthEast Region
ne = ds1.sort_values('INCOME_AMT', ascending=False)[['NAME', 'CITY', 'STATE', 'ASSET_AMT',
                                                     'INCOME_AMT','REVENUE_AMT']].head(10)
ne['Region'] = 'NorthEast'

#MidWest Region
mw = ds2.sort_values('INCOME_AMT', ascending=False)[['NAME', 'CITY', 'STATE', 'ASSET_AMT',
                                                     'INCOME_AMT','REVENUE_AMT']].head(10)
mw['Region'] = 'MidWest/MidAtlantic'

#SouthEast and Western Regions
se = ds3.sort_values('INCOME_AMT', ascending=False)[['NAME', 'CITY', 'STATE', 'ASSET_AMT',
                                                     'INCOME_AMT','REVENUE_AMT']].head(10)
se['Region'] = 'SouthEast/West'
With a merge and concatation, we get the resulting list below.
merged_data = [ne, mw, se]
results = pd.concat(merged_data)
print(results)

EDA Lite
I wanted to answer a small question bugging me first. Specfically on why they decided to seperate the files based on the states they used. For example, why only put 8 states in eo1.csv and why 24 states in eo3.csv? Could it be based on some metric? Let’s find out.
I thought first it could be based on the number of organizations in a giving State. So below,
# Count of Non-Profits in each File
count1 = ds1.NAME.count()
count2 = ds2.NAME.count()
count3 = ds3.NAME.count()
print('DS1 has', count1, 'Organizations in the file.')
print('DS2 has', count2, 'Organizations in the file.')
print('DS3 has', count3, 'Organizations in the file.')
We get:
DS1 has 240579 Organizations in the file.
DS2 has 619129 Organizations in the file.
DS3 has 768922 Organizations in the file.
So as one would expect, the more States the more Non-profits in the file.
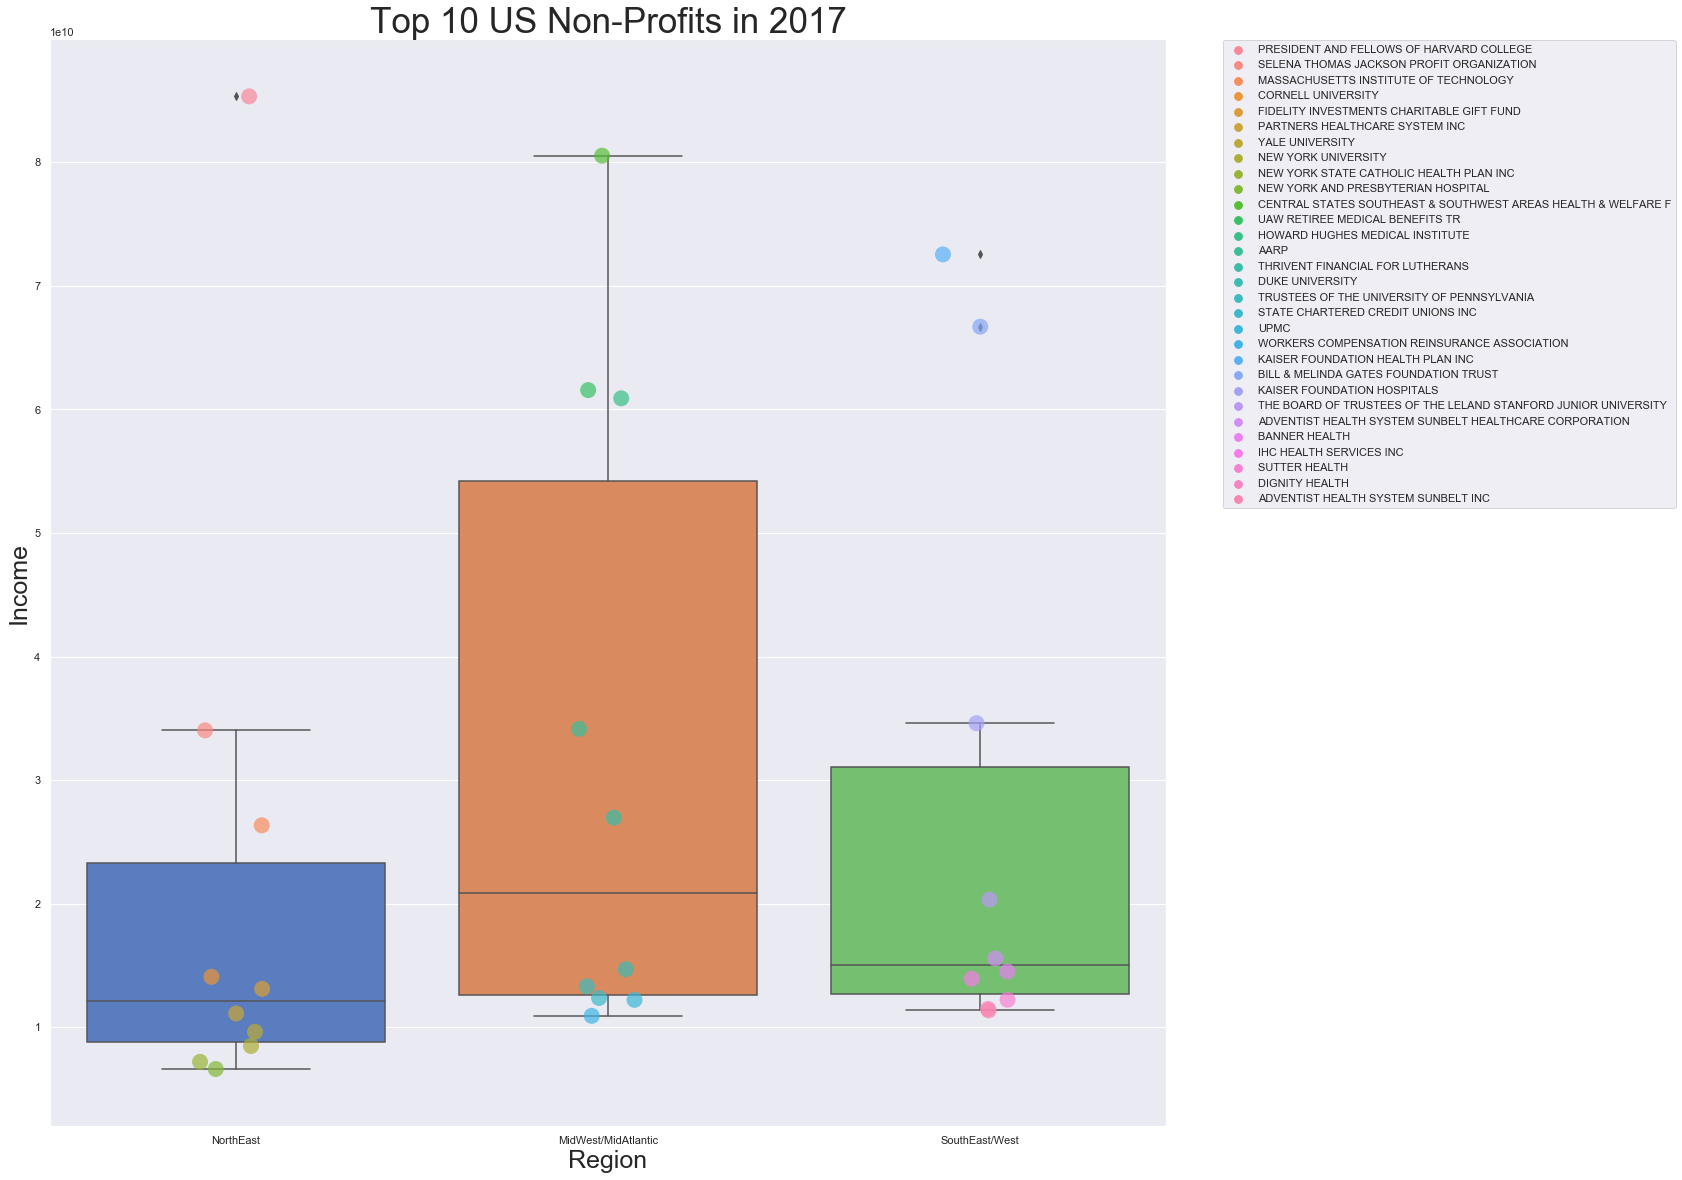
Next, the code below plots a boxplot with the spread of the Top 30 Non-Profits in the US based on Income.
#Plot Style
sns.set(style="darkgrid", palette="muted", color_codes=True)
#Create BoxPlot and Add Points
a = sns.boxplot(data = results, x = 'Region', y = 'INCOME_AMT')
sns.stripplot(x='Region', y='INCOME_AMT', data=results, jitter=True, size=16, linewidth=0, hue = 'NAME', alpha=0.7)
#Legend and Titles
a.legend(bbox_to_anchor=(1.05, 1.0), loc=2, borderaxespad=0.1)
a.axes.set_title('Top 10 US Non-Profits in 2017',fontsize=35)
a.set_xlabel('Region',fontsize=25)
a.set_ylabel('Income',fontsize=25)
plt.show()
 Conclusion:
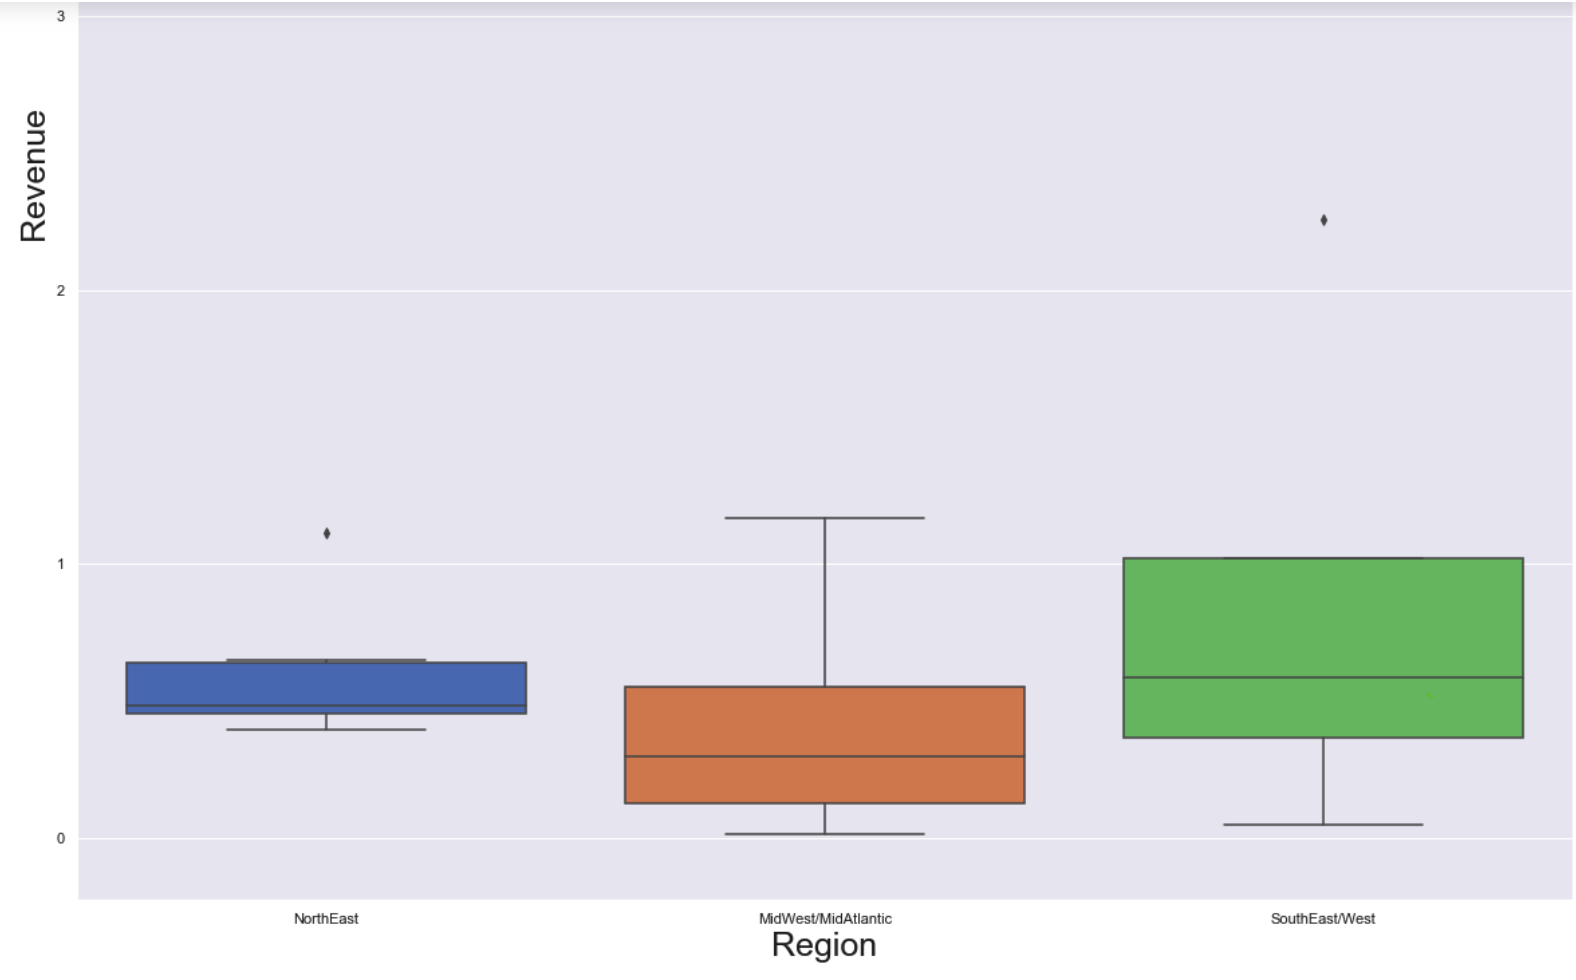
First, we looked at Income since that would be a true indicator of the “Profitability” of the organization. Some non-profits may take in a lot of donations, or revenue, but have to spend it on the goals and overhead to run the non-profit. The NorthEast region holds the highest organization based on Income, Presidents and Fellows of Harvard College, but the MidWest/MidAtlantic on average has a higher income with their organizations. When replacing
 y='INCOME_AMT' with the Revenue and Asset variables the Assets show a similar spread to Income. The revenue has a tighter spread and making me think as this data was chosen to be separated based on Revenue. See below
Data Cleaning Part II
Now we will separate the Top 10 Non-Profits per State based on Income, merge them, and export the new dataset for further EDA in Tableau.
My first instinct was to take my code from above and start creating new variables for each state, for each file, and merge/concat them into a new dataset.
ma = ds1[ds1.STATE == 'MA'].sort_values('INCOME_AMT', ascending=False)[['NAME', 'CITY', 'STATE', 'ASSET_AMT',
                                                     'INCOME_AMT','REVENUE_AMT']].head(10)
ny = ds1[ds1.STATE == 'NY'].sort_values('INCOME_AMT', ascending=False)[['NAME', 'CITY', 'STATE', 'ASSET_AMT',
                                                     'INCOME_AMT','REVENUE_AMT']].head(10)
nj = ds1[ds1.STATE == 'NJ'].sort_values('INCOME_AMT', ascending=False)[['NAME', 'CITY', 'STATE', 'ASSET_AMT',
                                                     'INCOME_AMT','REVENUE_AMT']].head(10)
...
merged_state_list = [ma,ny,nj,me,nh,vt,ct,ri,...]
final_set = pd.concat(merged_state_list)
Two problems with this method.
- This is a repetitive and inefficient way to run this code. In coding there is a principle called keeping your Code DRY, meaning, Don’t Repeat Yourself.
- We encounter issues with variables names like id, or, and in which have specific functions in Python.
Then it hit me like a brick wall…the GroupBy function! Now below does everything that I did above but just in a better, cleaner way.
# Use the groupby function to exact the data giving us the top 10 from each state.
new_ds1 = ds1.sort_values("INCOME_AMT", ascending=False).groupby("STATE").head(10)[['NAME', 'CITY', 'STATE', 'ASSET_AMT',
                                                     'INCOME_AMT','REVENUE_AMT']]
new_ds2 = ds2.sort_values("INCOME_AMT", ascending=False).groupby("STATE").head(10)[['NAME', 'CITY', 'STATE', 'ASSET_AMT',
                                                     'INCOME_AMT','REVENUE_AMT']]
new_ds3 = ds3.sort_values("INCOME_AMT", ascending=False).groupby("STATE").head(10)[['NAME', 'CITY', 'STATE', 'ASSET_AMT',
                                                     'INCOME_AMT','REVENUE_AMT']]
#Merge and Concat Data
merged_state_list = [new_ds1, new_ds2, new_ds3]

final_set = pd.concat(merged_state_list)
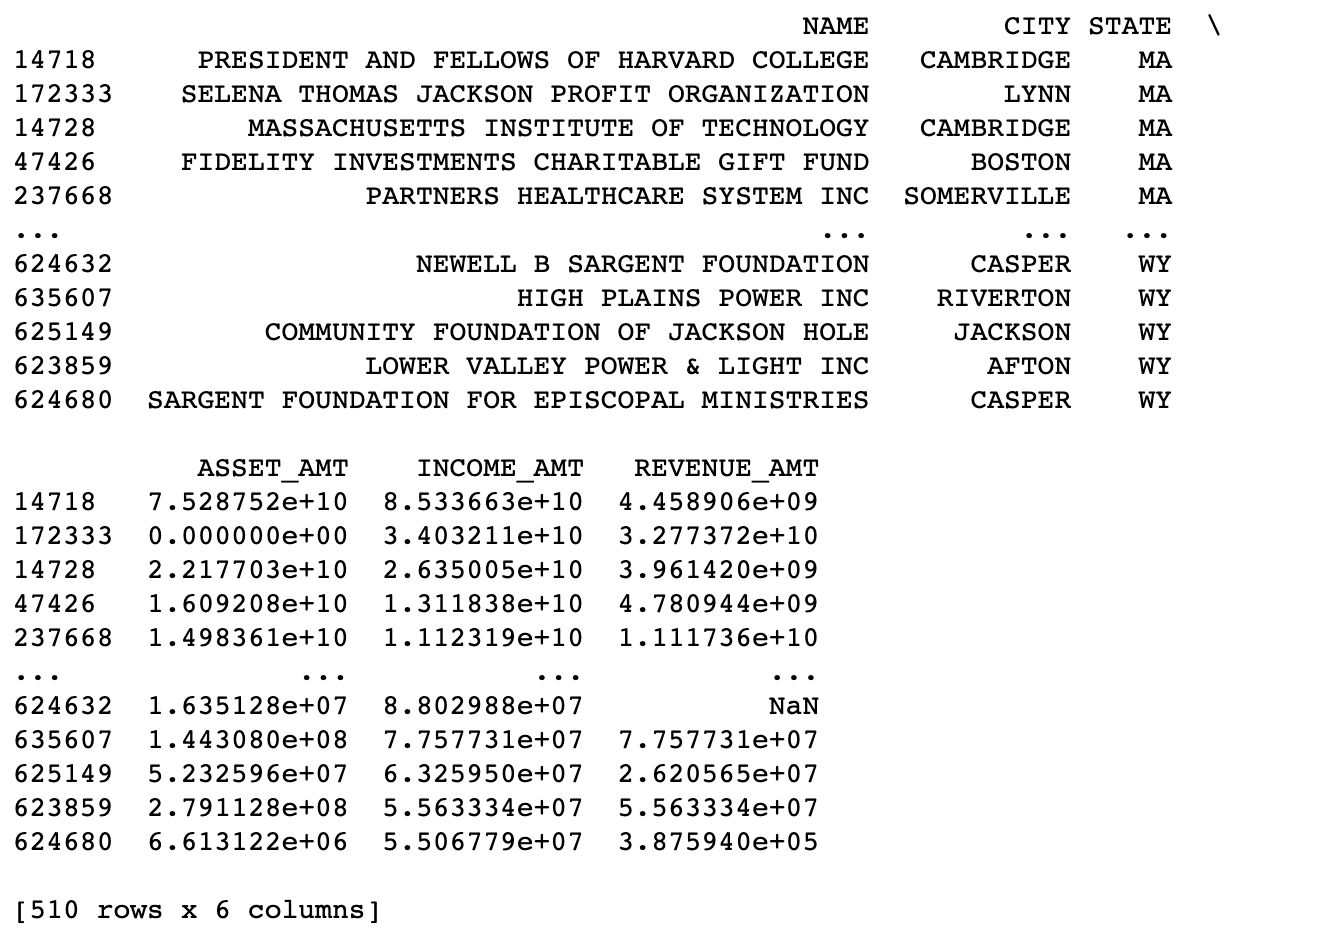
print(final_set)
Exploratory Data Analysis (EDA)
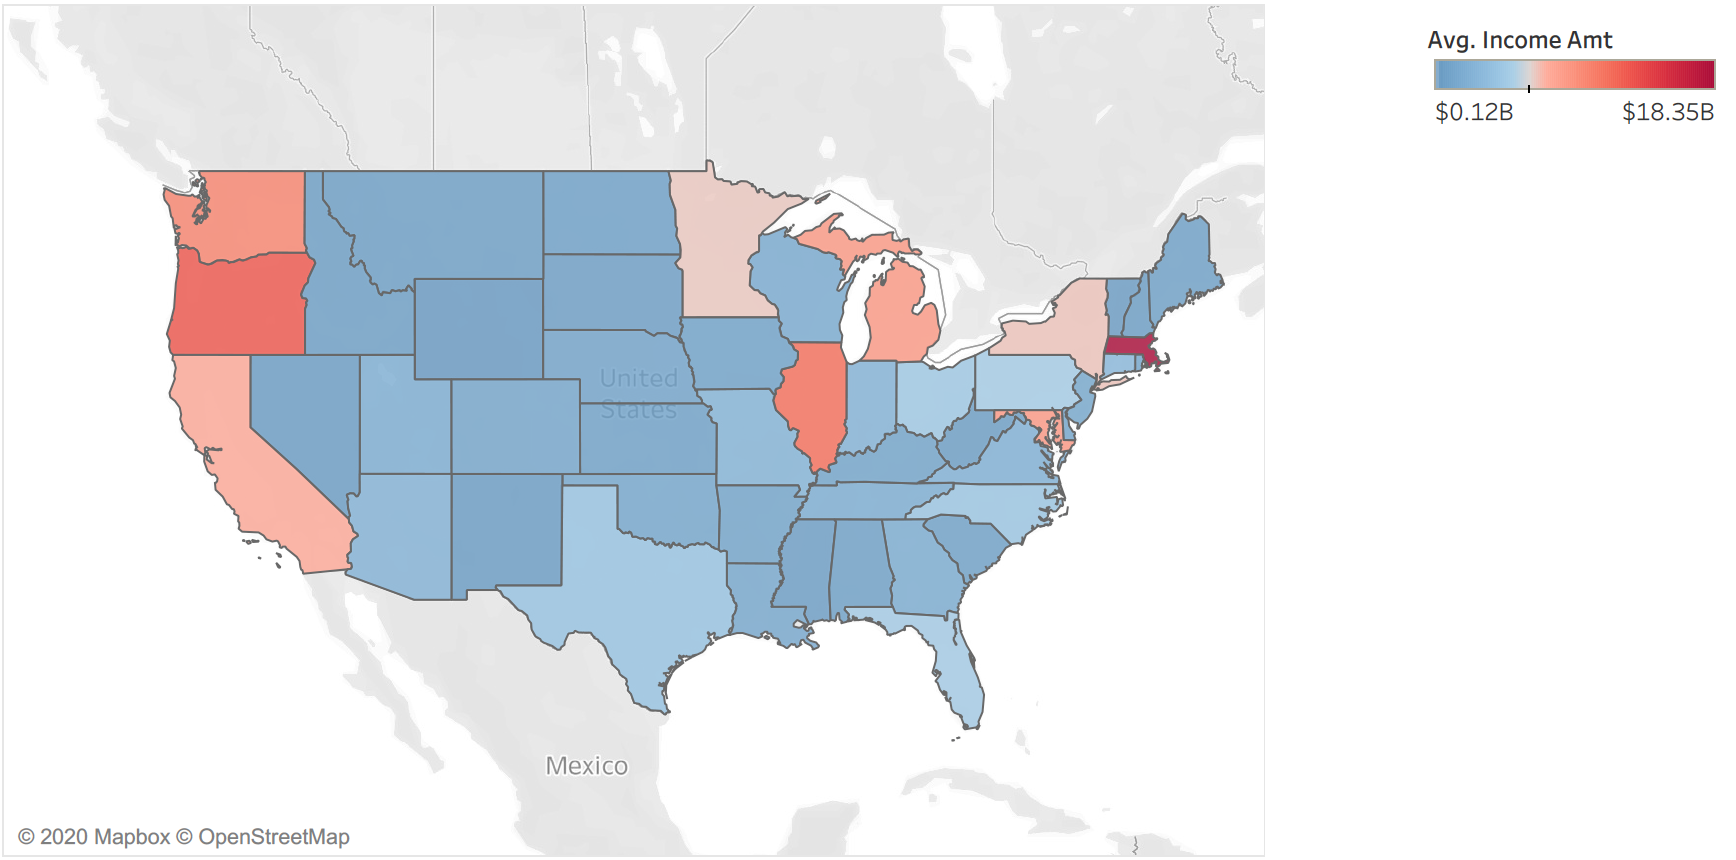
Map of Average Income per State
Top 5 States:
- Massachusetts $18.4B
- Oregon $12.6B
- Illinois $11.3B
- Washington $10.0B
- Maryland $8.6B
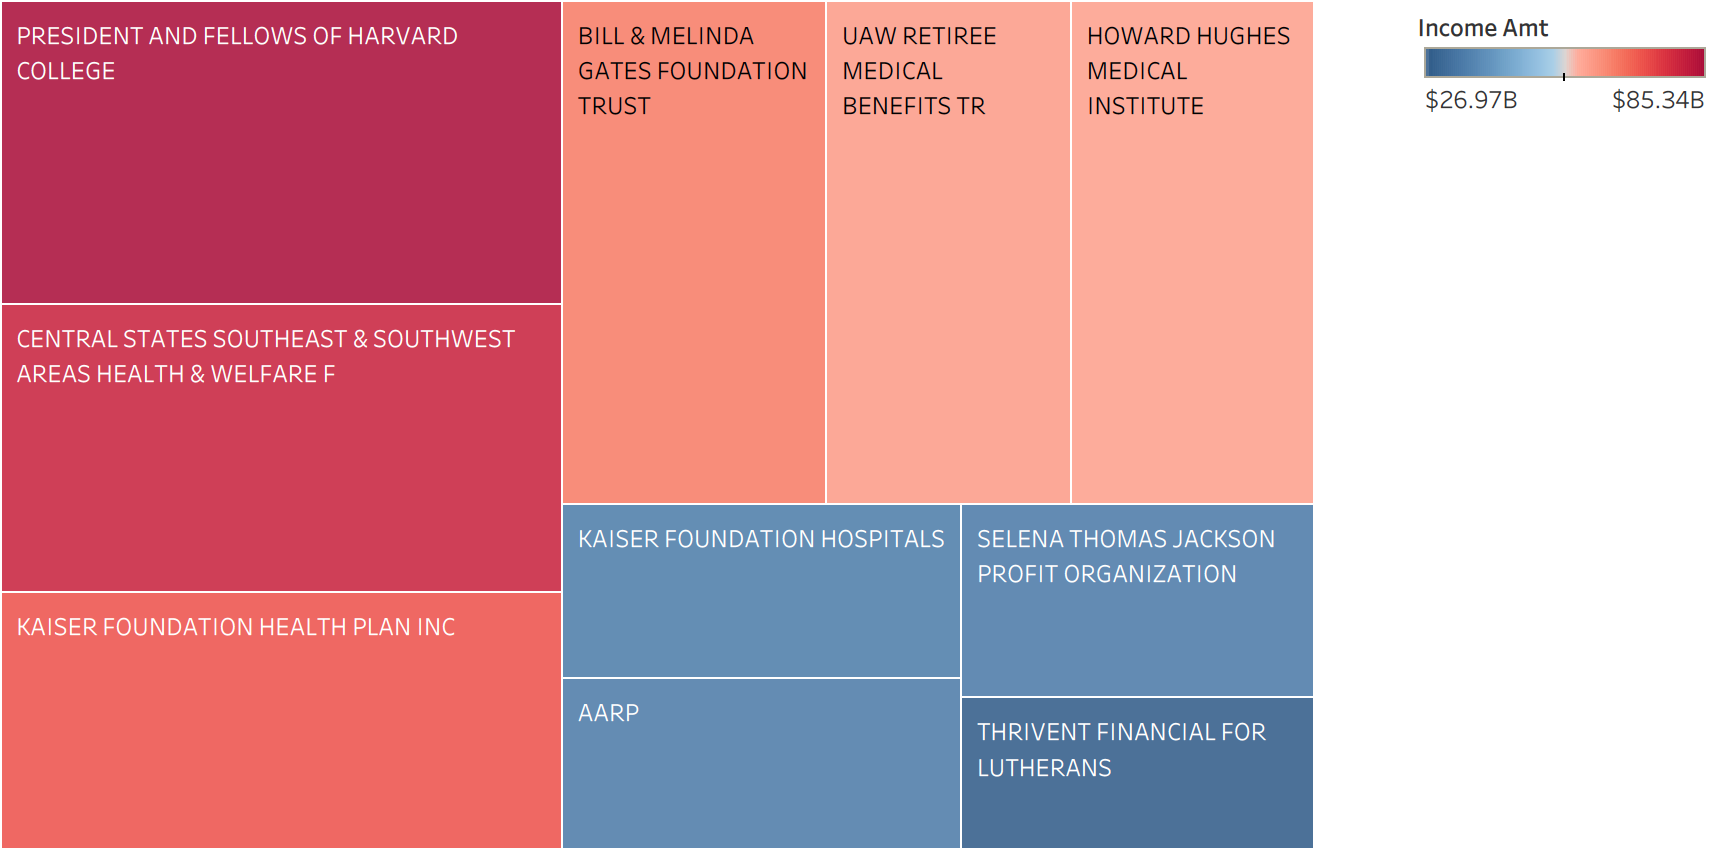
Top 10 Based on Income
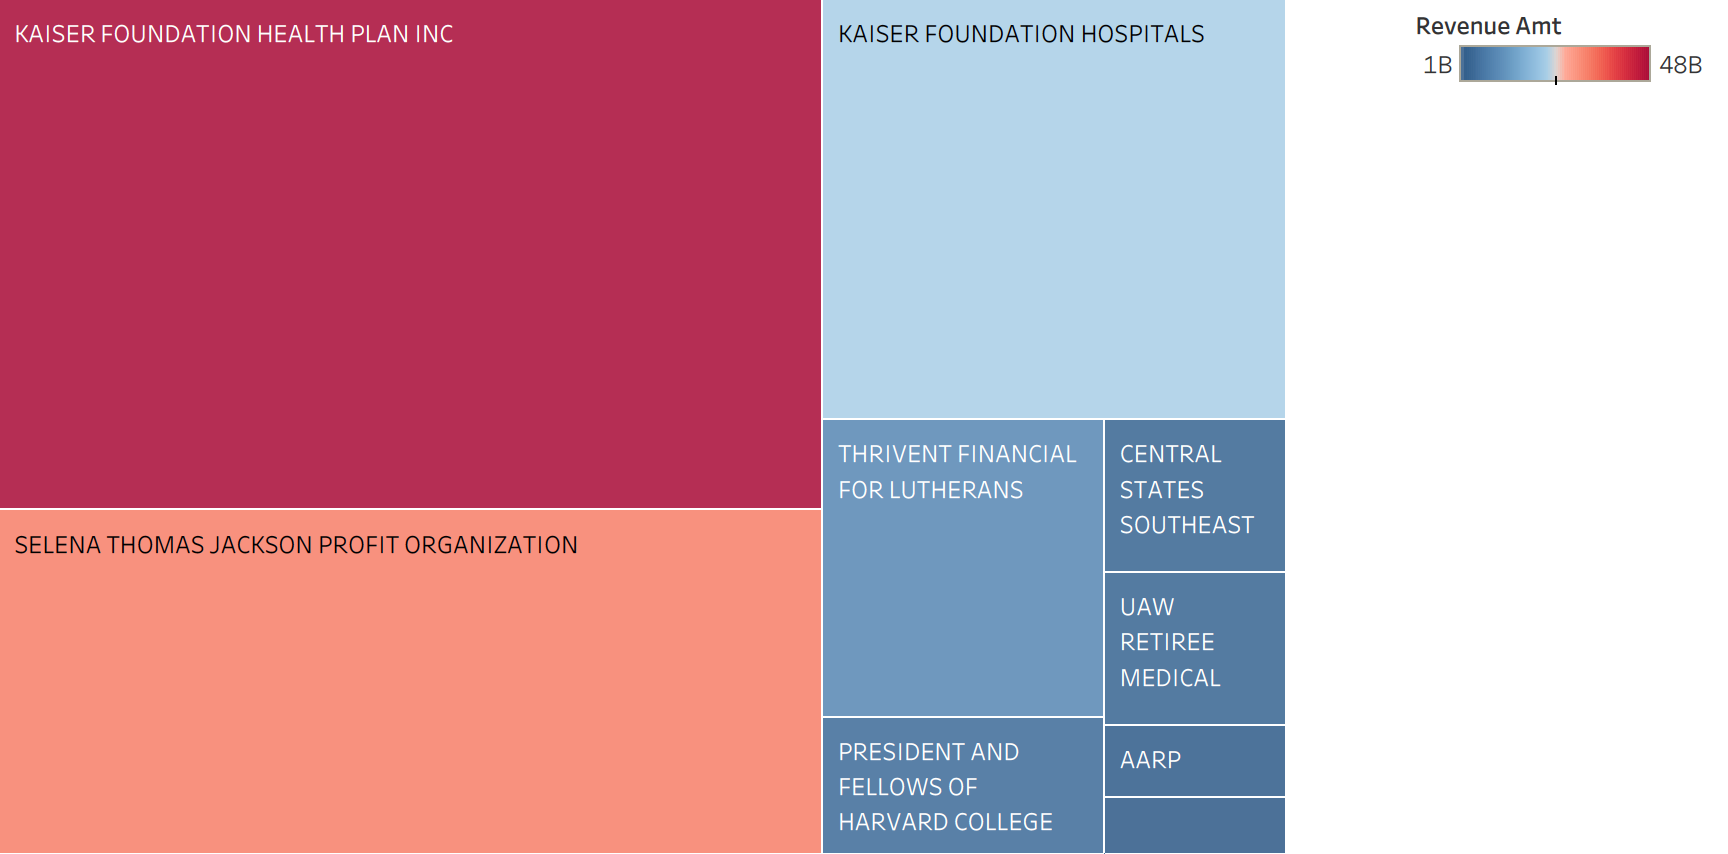
Top 10 Based on Revenue
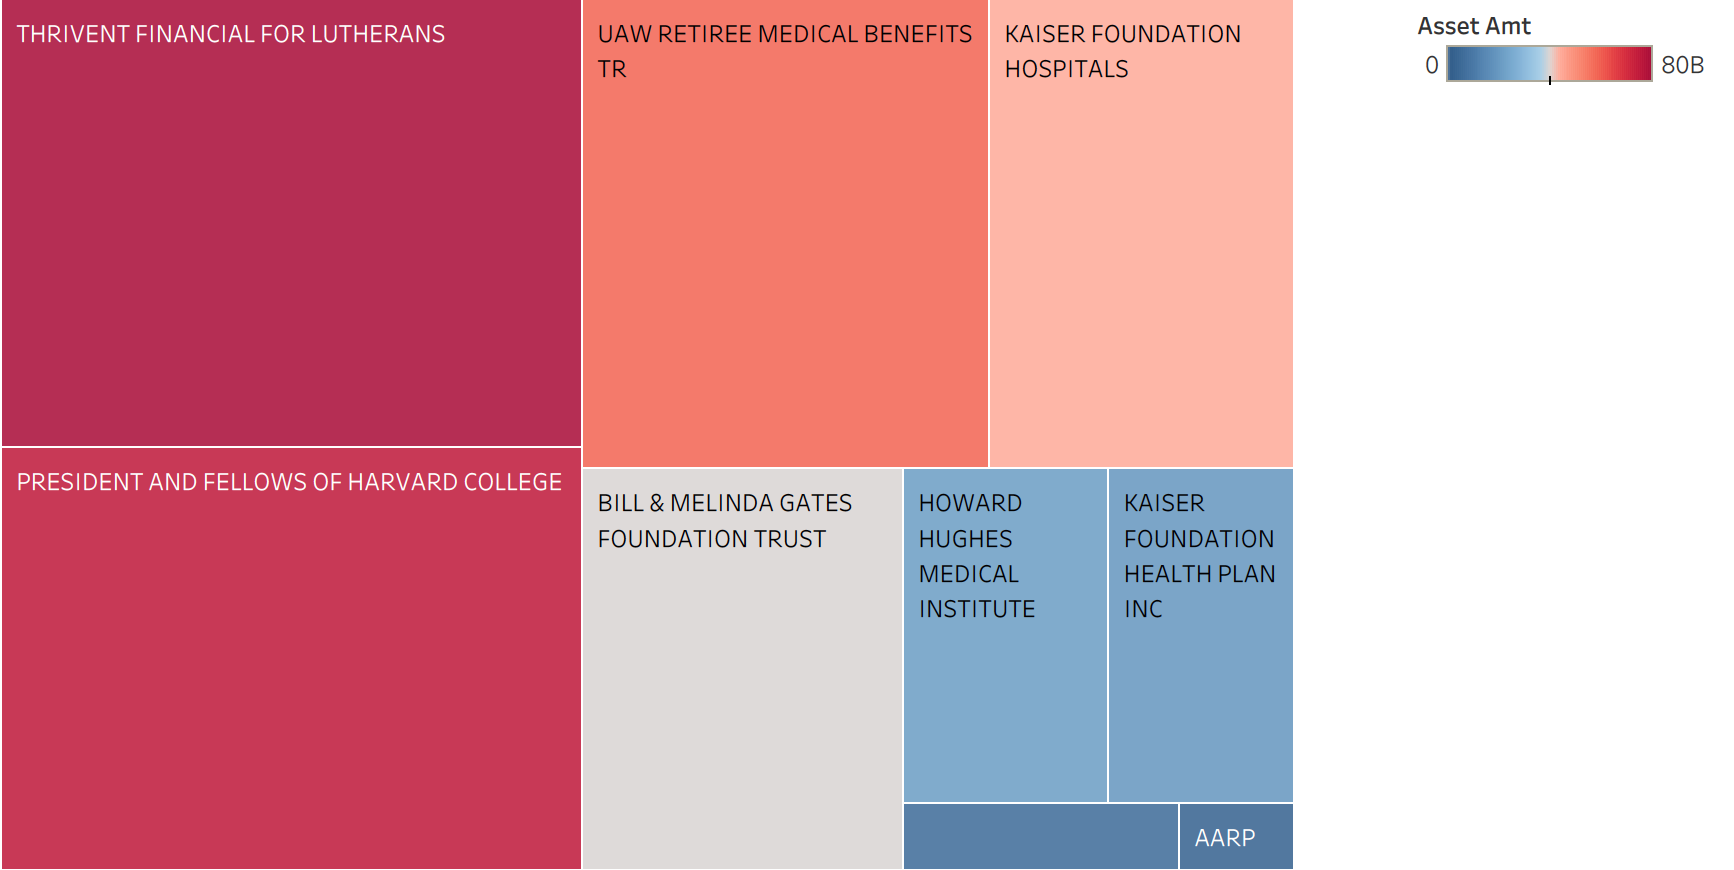
Top 10 Based on Assets
Final Thoughts
I really appreciate anyone who took the time to read through. I’m mainly building these posts as a way to reteach myself the tools and techniques I have been using and learning the past year and half. Hopefully with the help of the Protégé Effect where by teaching, or even pretending to teach, information to others helps that person learn the information. I’m looking forward to making more complex projects and solving business problems. Thank you again!
